Day 7: Fine-Tune Hyperparameters With Keras Tuner on a Small NN
Today we will explore hyperparameter tuning using the Keras Tuner, which is a powerful tool for optimizing the hyperparameters of a model to achieve the best possible performance. This will involve tuning different aspects of a neural network, like the number of neurons, learning rate, batch size, etc., to see how they impact performance.
What is Hyperparameter Tuning?
- Hyperparameters are settings that you need to define before training your model, such as the number of neurons in a layer, the learning rate of the optimizer, the batch size, and the number of layers.
- Hyperparameter tuning is the process of finding the best combination of these settings to maximize the model’s performance.
- Keras Tuner is a library that helps automate the process of trying different combinations of hyperparameters.
Plan:
- Install and import Keras Tuner.
- Define a simple neural network model for tuning.
- Use Keras Tuner to find the optimal hyperparameters.
- Train and evaluate the best model.
We’ll create a small neural network and use the Keras Tuner to fine-tune the hyperparameters.
Step-by-Step Implementation
Step 1: Install and Import Keras Tuner
First, if you don’t have Keras Tuner installed, you’ll need to install it:
pip install keras-tuner
Next, import the necessary libraries.
import tensorflow as tf
from tensorflow.keras.models import Sequential
from tensorflow.keras.layers import Dense
from sklearn.model_selection import train_test_split
from sklearn.datasets import load_breast_cancer
import kerastuner as kt
Step 2: Load and Preprocess Data
We’ll use the Breast Cancer dataset from sklearn, which is relatively small and great for this task.
# Load the Breast Cancer dataset
data = load_breast_cancer()
X = data.data
y = data.target

# Split the dataset into training and validation sets
X_train, X_val, y_train, y_val = train_test_split(X, y, test_size=0.2, random_state=42)
- Breast Cancer Dataset: This dataset is used for binary classification (predicting whether cancer is benign or malignant).
- Train/Test Split: We split the data into training and validation sets (80%-20%).
Step 3: Define the Hypermodel Function
We will create a function that uses Keras Tuner to explore different combinations of hyperparameters.
def build_model(hp):
    model = Sequential()

    # Tune the number of units in the first Dense layer
    hp_units = hp.Int('units', min_value=8, max_value=128, step=8)
    model.add(Dense(units=hp_units, activation='relu', input_shape=(X_train.shape[1],)))

    # Tune the learning rate for the optimizer
    hp_learning_rate = hp.Choice('learning_rate', values=[1e-2, 1e-3, 1e-4])
    model.add(Dense(1, activation='sigmoid'))

    model.compile(optimizer=tf.keras.optimizers.Adam(learning_rate=hp_learning_rate),
                  loss='binary_crossentropy',
                  metrics=['accuracy'])
    return model
hp.Int('units', min_value=8, max_value=128, step=8): This allows Keras Tuner to try different numbers of neurons in the first Dense layer, ranging from 8 to 128, in steps of 8.hp.Choice('learning_rate', values=[1e-2, 1e-3, 1e-4]): This allows the tuner to try different learning rates.- The model uses a Dense layer with a sigmoid activation for binary classification.
Step 4: Set Up the Keras Tuner
We will use the RandomSearch tuner to find the best set of hyperparameters.
# Set up the tuner
tuner = kt.RandomSearch(
    build_model,
    objective='val_accuracy',
    max_trials=5,  # Number of different models to try
    executions_per_trial=3,  # Number of times to train each model
    directory='my_dir',
    project_name='intro_to_kt'
)

# Search for the best hyperparameters
tuner.search(X_train, y_train, epochs=10, validation_data=(X_val, y_val))
kt.RandomSearch(): This tuner will randomly sample combinations of hyperparameters to find the best set.objective='val_accuracy': The tuner will try to maximize validation accuracy.max_trials=5: The tuner will test 5 different combinations of hyperparameters.executions_per_trial=3: Each model will be trained 3 times to get an average result, which adds stability to the evaluation.directory: This is the folder where Keras Tuner will store all the tuning logs and results.project_name: This helps organize different projects within the same directory.
Step 5: Get the Best Model
Once the search is complete, we can get the best model and hyperparameters.
# Get the best hyperparameters
best_hps = tuner.get_best_hyperparameters(num_trials=1)[0]
print(f"Best number of units: {best_hps.get('units')}")
print(f"Best learning rate: {best_hps.get('learning_rate')}")

# Build the model with the best hyperparameters
best_model = tuner.hypermodel.build(best_hps)

# Train the best model on the full training set
history = best_model.fit(X_train, y_train, validation_data=(X_val, y_val), epochs=20)
tuner.get_best_hyperparameters(): This retrieves the best set of hyperparameters found during the search.tuner.hypermodel.build(best_hps): Builds the best model based on these hyperparameters.- Train the Best Model: We retrain the best model for a longer time (20 epochs) to see how well it performs.
Step 6: Visualize Training Performance
We can visualize the training history to see how the model performs over time.
import matplotlib.pyplot as plt

# Convert the history to a DataFrame for easy visualization
import pandas as pd
history_df = pd.DataFrame(history.history)

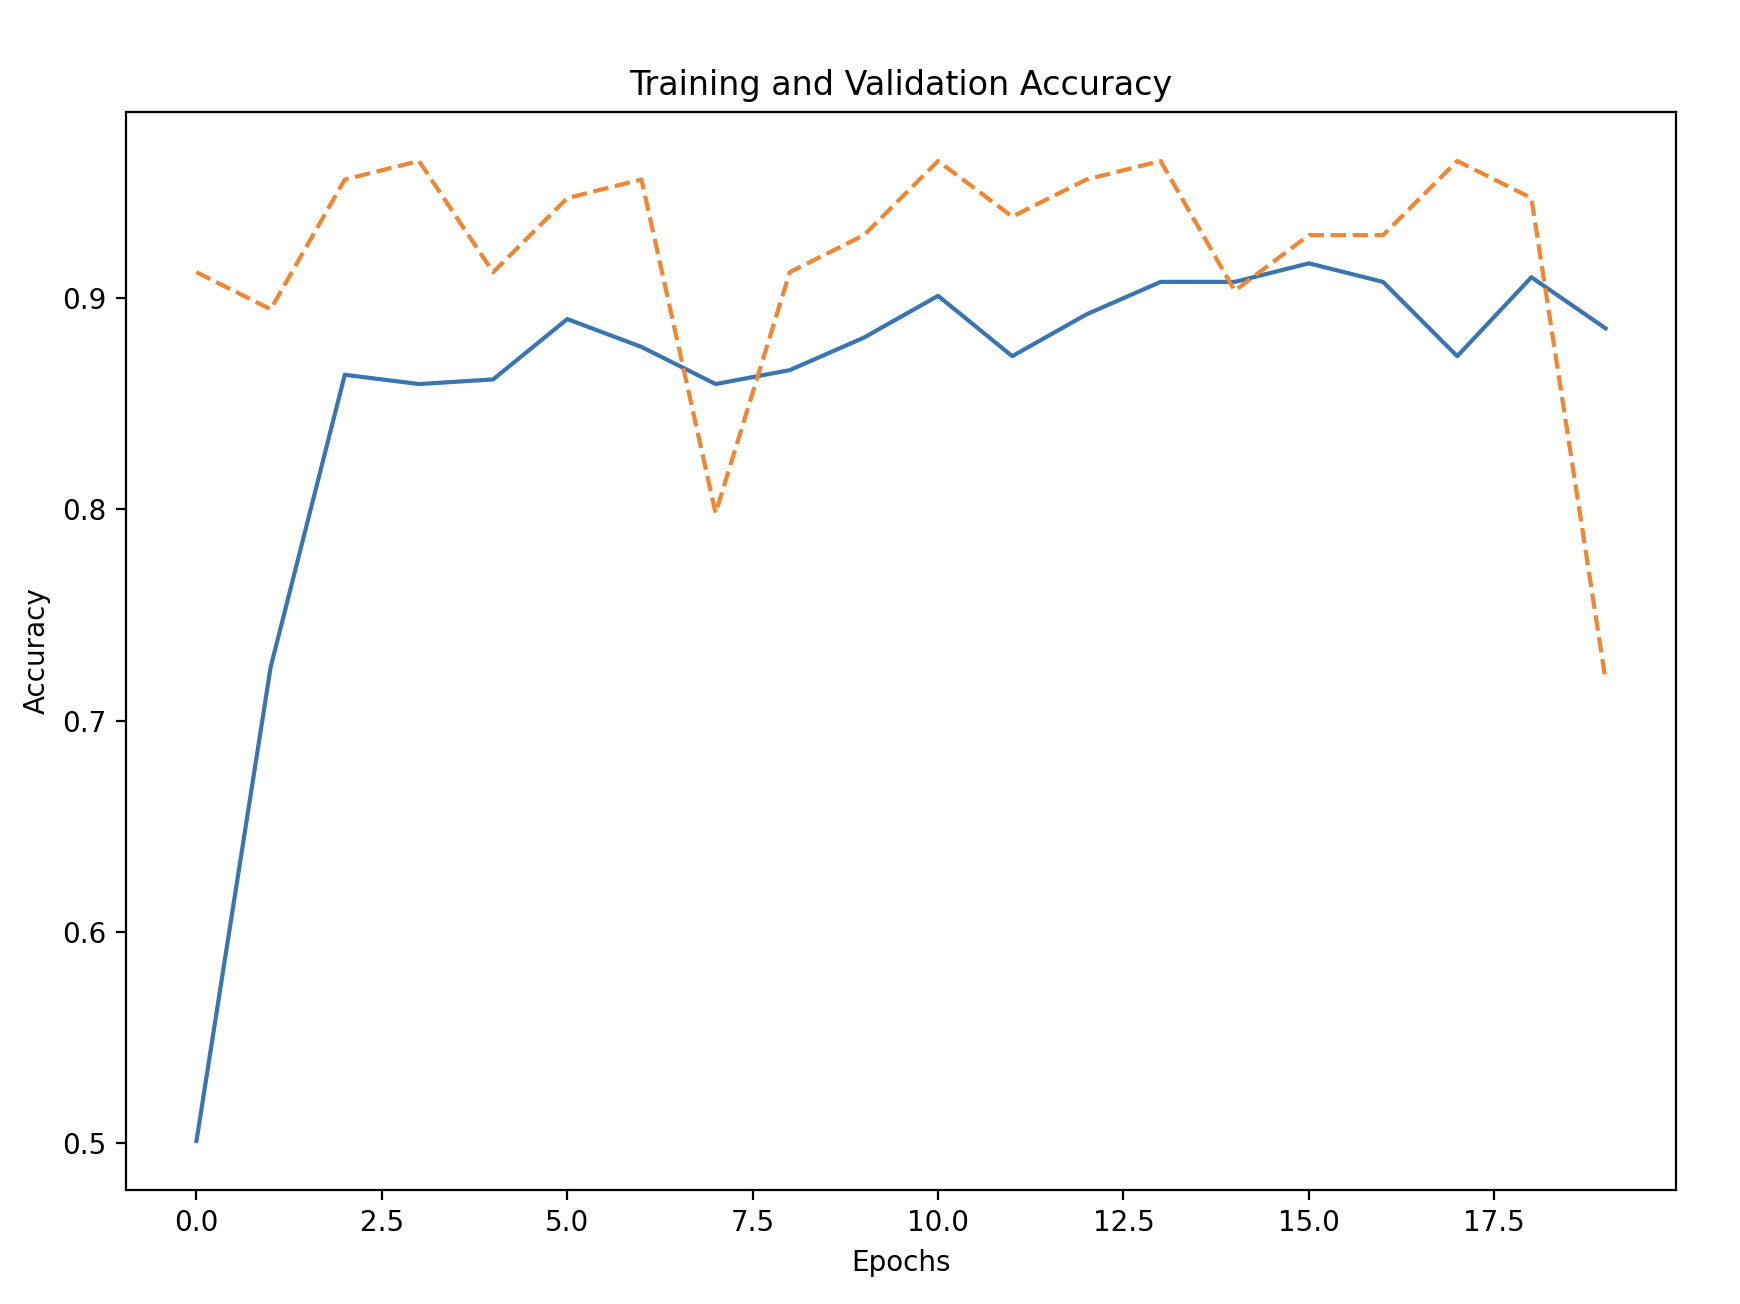
# Plot training and validation accuracy
plt.figure(figsize=(10, 6))
plt.plot(history_df['accuracy'], label='Training Accuracy')
plt.plot(history_df['val_accuracy'], linestyle='--', label='Validation Accuracy')
plt.xlabel('Epochs')
plt.ylabel('Accuracy')
plt.title('Training and Validation Accuracy')
plt.legend()
plt.show()

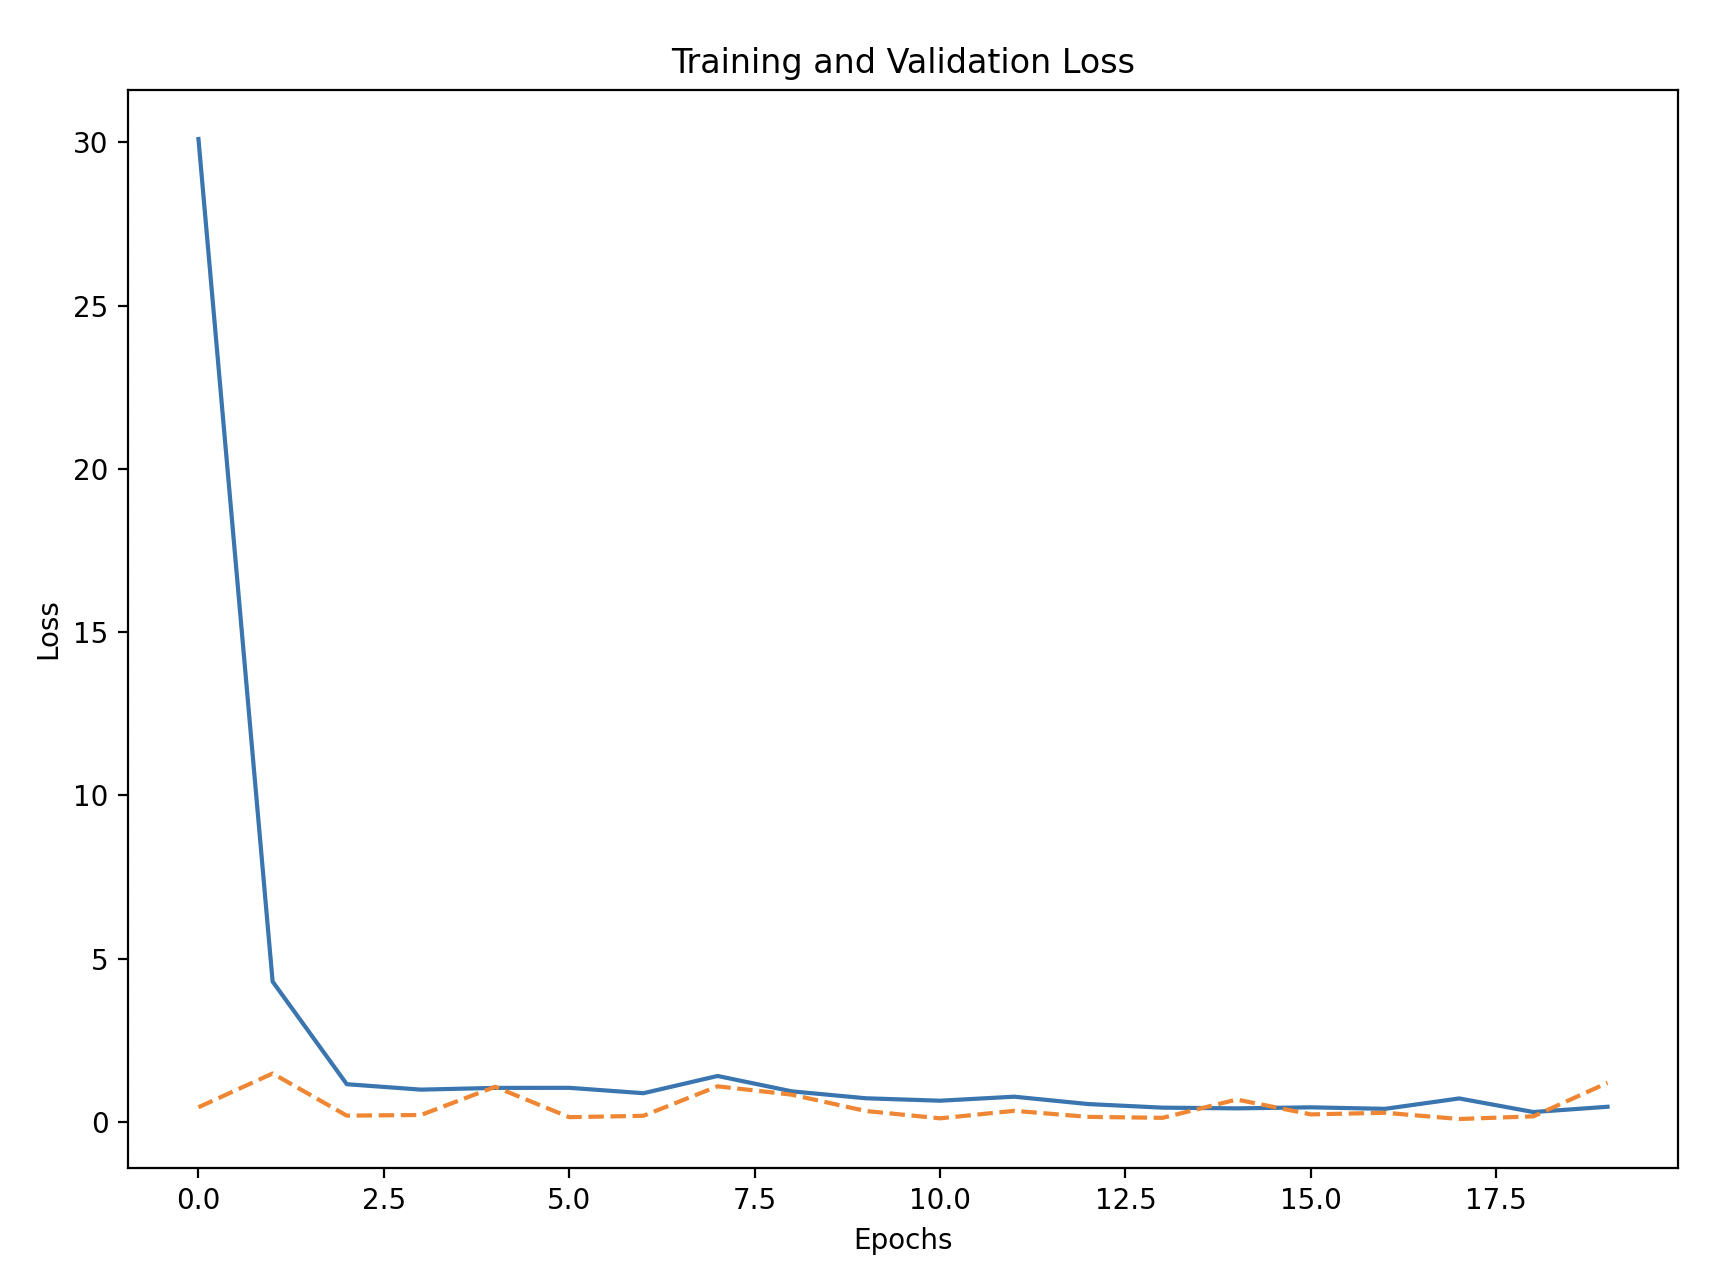
# Plot training and validation loss
plt.figure(figsize=(10, 6))
plt.plot(history_df['loss'], label='Training Loss')
plt.plot(history_df['val_loss'], linestyle='--', label='Validation Loss')
plt.xlabel('Epochs')
plt.ylabel('Loss')
plt.title('Training and Validation Loss')
plt.legend()
plt.show()
Training and Validation Accuracy/Loss: Plot the accuracy and loss to see how the model performed during training and if it generalized well to the validation set.

