
Today is the first day of the 30 days 30 ML projects challenge. I got up at 5:30 am, which was 30 minutes later than I planned.
I recorded my screen to keep track of what I did, which helped me write this post. Now I’m thinking about posting it on YouTube like a series of development logs. I’ll share the video link at the end so you can see how I start from scratch. I think that’s pretty cool.
If you want to go straight to the code, I’ve uploaded it to this repository GIT REPO
Flow#
I planned to read blogs and tutorials for reference. Then, I realized that I could use ChatGPT.
I asked ChatGPT to help solve the problem, telling it to assume I have a basic understanding of Machine Learning and to start with simple models, getting more complex as we go.
I’m going to use the same context window for future problems. This way, I can make the most of ChatGPT without having to train from scratch each time.
I typed out each line of the code myself, actually copying it, and made changes where needed. If I didn’t understand something, I asked ChatGPT to clarify. This way, I’m learning and will be able to write code on my own for future problems.
Talk about the Problem Please!!#
The challenge for day one was to “Predict house prices using Simple Linear Regression”. It is a classic problem in machine learning.
Packages Required.#
I installed the necessary packages. Here’s what you need to set up:
pip install pandas scikit-learn matplotlib numpyWhy is it a Linear Regression Problem?#
It is clearly a regression problem because predicting house prices results in a continuous outcome, not belonging to any set category.
I chose the Linear Regression model for its simplicity and ease of implementation. Unlike more complex models, it doesn’t require data preprocessing. This makes it an excellent choice for a straightforward Day 1 project.
Understanding the Data#
I am using fetch_california_housing from sklearn.datasets. The California Housing dataset is a well-known dataset that contains data about houses in California. It includes various features, but for the simplicity of this example, we’ll focus on two key variables:
MedInc: Median income in the block group
MedHouseVal: Median house value for California districts (target variable)
Boston Housing from Kaggle is another excellent option for acquiring a suitable dataset for this problem.
The Code Workflow#
The workflow involves six major steps:
- Loading the dataset
- Selecting features and target
- Splitting the dataset
- Creating and training the model
- Evaluating the model’s performance
- Visualizing the results
Let’s dive into each step:
Step 1: Load the Dataset#
I used fetch_california_housing from sklearn.datasets. I have set the paramter as_frame to true to get the data as a Pandas DataFrame. It will help in analysing the data easily, like with function head(), the table structure with top 5 rows.
california_housing = fetch_california_housing(as_frame=True)
california_housing_df = california_housing.frame
Step 2: Select Features and Target#
In Simple Linear Regression, we predict the outcome based on a single feature. Here, I’m using median income (MedInc) as our feature stored in X, predicting MedHouseVal as our target y, the median house value.
Step 3: Split the Dataset#
I split the data into a training set (80%) and a validation set (20%).
Step 4: Create and Train the Model#
Create an instance of LinearRegression model and train it using the fit method on the training data.
Step 5: Evaluation#
After training, i have used Root Mean Squared Error (RMSE) to evaluate the accuracy of the model. Here is the result
The Root Mean Squared error is: 0.8420901241414454Step 6: Visualization#
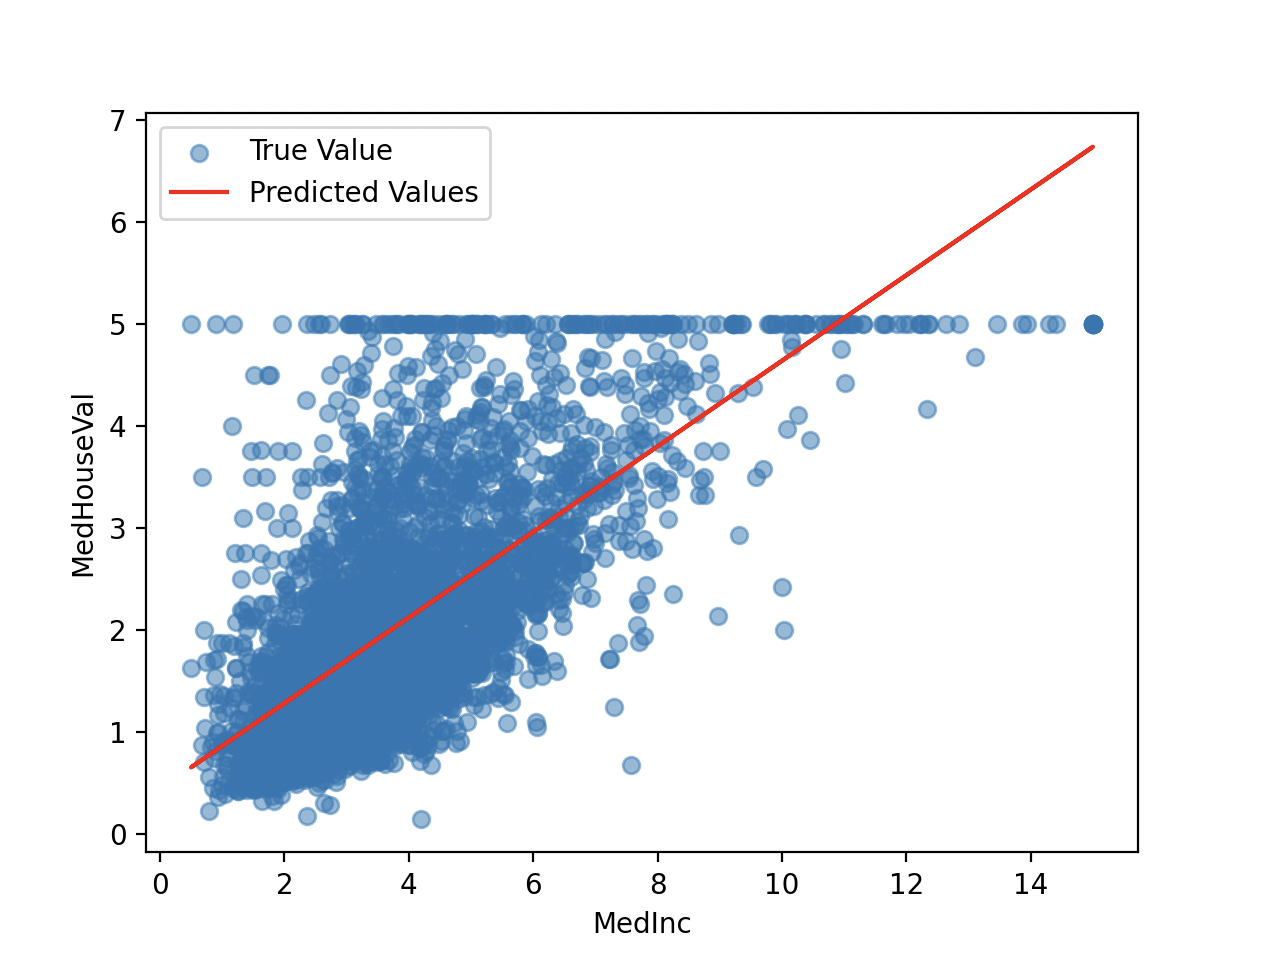
I used matplotlib.pyplot package to plot a graph for visualizing the true the true median house values against the predicted values to see how well the model performed.
Gratitude#
I finished in 1 hour, which was faster than I planned. I am really happy with this progress and excited to continue the challenge without missing a day.
Stay Tuned!!