Day 12 - 30 Days 30 Machine Learning Projects Challenge
Problem: Predicting Airline Passenger Satisfaction with Gradient Boosting Machine (GBM)
Hey, it’s Day 12 of the 30 Day 30 Machine Learning Projects Challenge! Today, the task was to predict whether airline passengers were satisfied or dissatisfied with their flight experience using a Gradient Boosting Machine (GBM) model. Let’s walk through how we solved this problem, what GBM is, and why we used One-Hot Encoding to prepare our data.
If you want to see the code, you can find it here: GIT REPO.
The Problem
The challenge was to predict airline passenger satisfaction using features such as flight distance, in-flight services, seat class, and more. The goal was to build a machine learning model to classify passengers as satisfied or dissatisfied based on their flight experience.
Understanding the Data
We used the Airline Passenger Satisfaction Dataset from Kaggle. The dataset includes columns such as Age, Flight Distance, Type of Travel (business or personal), Class (Economy, Business), and in-flight service ratings. The target column, ‘satisfaction’, had values:
- Satisfied (1)
- Neutral or Dissatisfied (0)
Download and place it in the dataset directory of your project.
Code Workflow
The process was divided into several steps:
- Load the data
- Preprocess the data using One-Hot Encoding
- Build and Train the Gradient Boosting Model
- Make Predictions and Evaluate
- Visualization
Step 1: Load the Data
We loaded the training and test datasets from the dataset directory:
train_data = pd.read_csv('dataset/airline_passenger_satisfaction_train.csv')
test_data = pd.read_csv('dataset/airline_passenger_satisfaction_test.csv')
Step 2: Preprocess the Data
We applied One-Hot Encoding to convert the categorical variables (like Gender, Class, Type of Travel) into binary columns that machine learning models can understand.
What is One-Hot Encoding?
One-Hot Encoding is a method used to convert categorical variables into binary (0/1) columns. For example, if a column called ‘Class’ has values like “Business”, “Eco”, and “Eco Plus”, one-hot encoding will create new columns such as ‘Class_Business’, ‘Class_Eco’, and ‘Class_Eco Plus’. Each row will have a value of 1 for the column corresponding to the category that applies.
Example: Class Eco will be transformed to:
- Class_Business: 0
- Class_Eco: 1
- Class_Eco Plus: 0
X_train = pd.get_dummies(train_data.drop('satisfaction', axis=1), drop_first=True)
y_train = train_data['satisfaction'].map({'satisfied': 1, 'neutral or dissatisfied': 0})
X_val = pd.get_dummies(test_data.drop('satisfaction', axis=1), drop_first=True)
y_val = test_data['satisfaction'].map({'satisfied': 1, 'neutral or dissatisfied': 0})
Step 3: Build and Train the Model
We used a Gradient Boosting Machine (GBM), which is a powerful algorithm that builds multiple models (weak learners) sequentially. Each new model tries to correct the errors made by the previous ones, resulting in improved accuracy.
What is Gradient Boosting Machine (GBM)?
GBM is an ensemble learning method where decision trees are built sequentially. Each tree corrects the errors of the previous trees. The idea is to boost weak models (small trees) into a strong predictive model. It works well for both classification and regression tasks.
We set random_state=42 to ensure that the results are consistent every time we run the code.
model = GradientBoostingClassifier(random_state=42)
model.fit(X_train, y_train)
Step 4: Make Predictions and Evaluate
We made predictions on the validation set and evaluated the model using accuracy score, confusion matrix, and classification report.
predictions = model.predict(X_val)
accuracy_score = accuracy_score(y_val, predictions)
print("Accuracy Score:\n", accuracy_score)
confusion_matrix = confusion_matrix(y_val, predictions)
print("Confusion Matrix:\n", confusion_matrix)
classification_report = classification_report(y_val, predictions)
print("Classification Report:\n", classification_report)
Here’s the output:
Accuracy Score:
 0.9418375622755185
Confusion Matrix:
 [[13919   609]
 [  897 10468]]
Classfication Report:
               precision    recall  f1-score   support

            0       0.94      0.96      0.95     14528
            1       0.95      0.92      0.93     11365

    accuracy                           0.94     25893
   macro avg       0.94      0.94      0.94     25893
weighted avg       0.94      0.94      0.94     25893
Step 5: Visualization
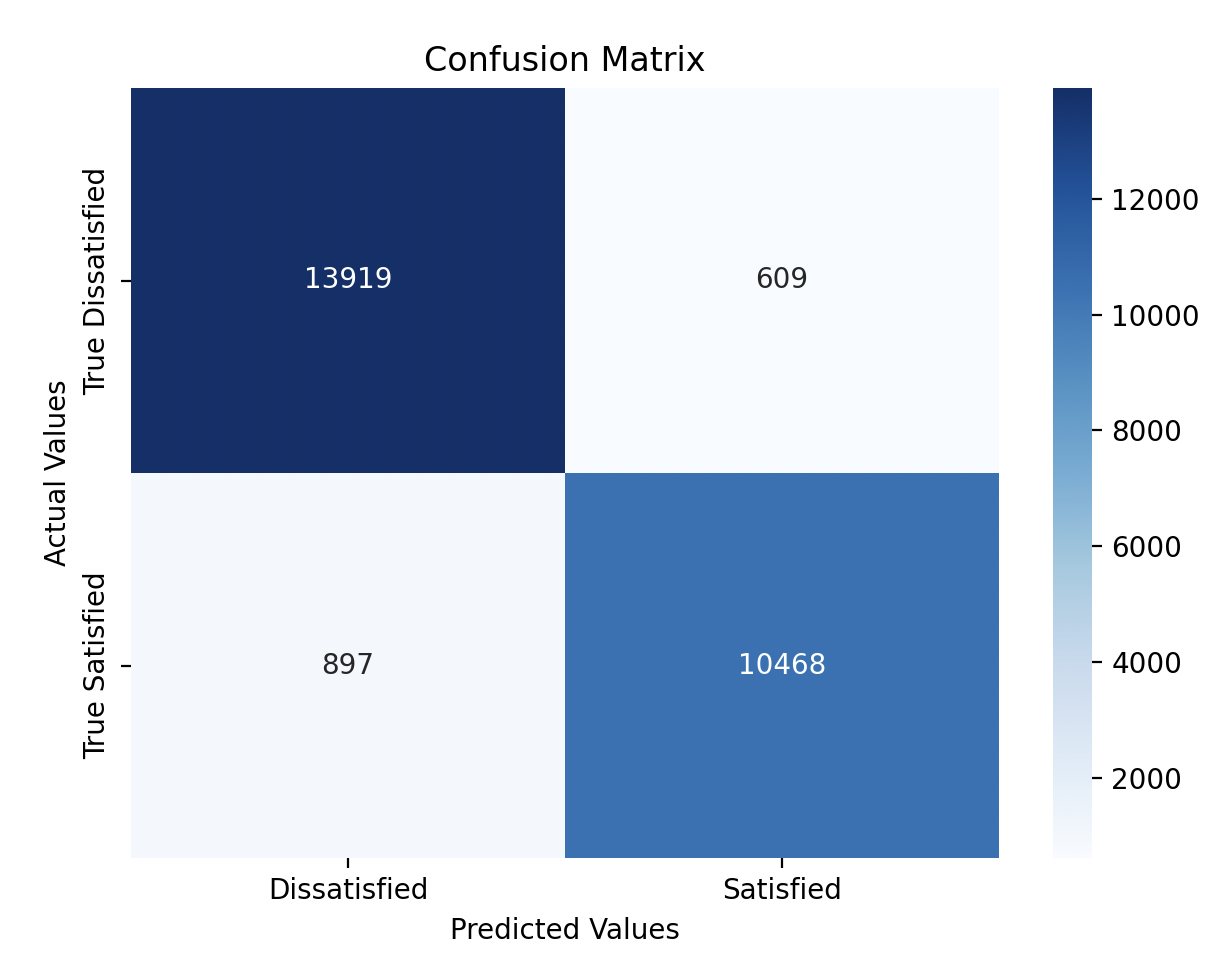
Confusion Matrix Heatmap
We used a heatmap to visualize the confusion matrix, showing how well the model classified satisfied vs dissatisfied passengers.
plt.figure(figsize=(7,5))
sns.heatmap(confusion_matrix, annot=True, fmt='d', cmap='Blues', xticklabels=['Dissatisfied', 'Satisfied'], yticklabels=['True Dissatisfied', 'True Satisfied'])
plt.xlabel('Predicted Values')
plt.ylabel('Actual Values')
plt.title('Confusion Matrix')
plt.show()
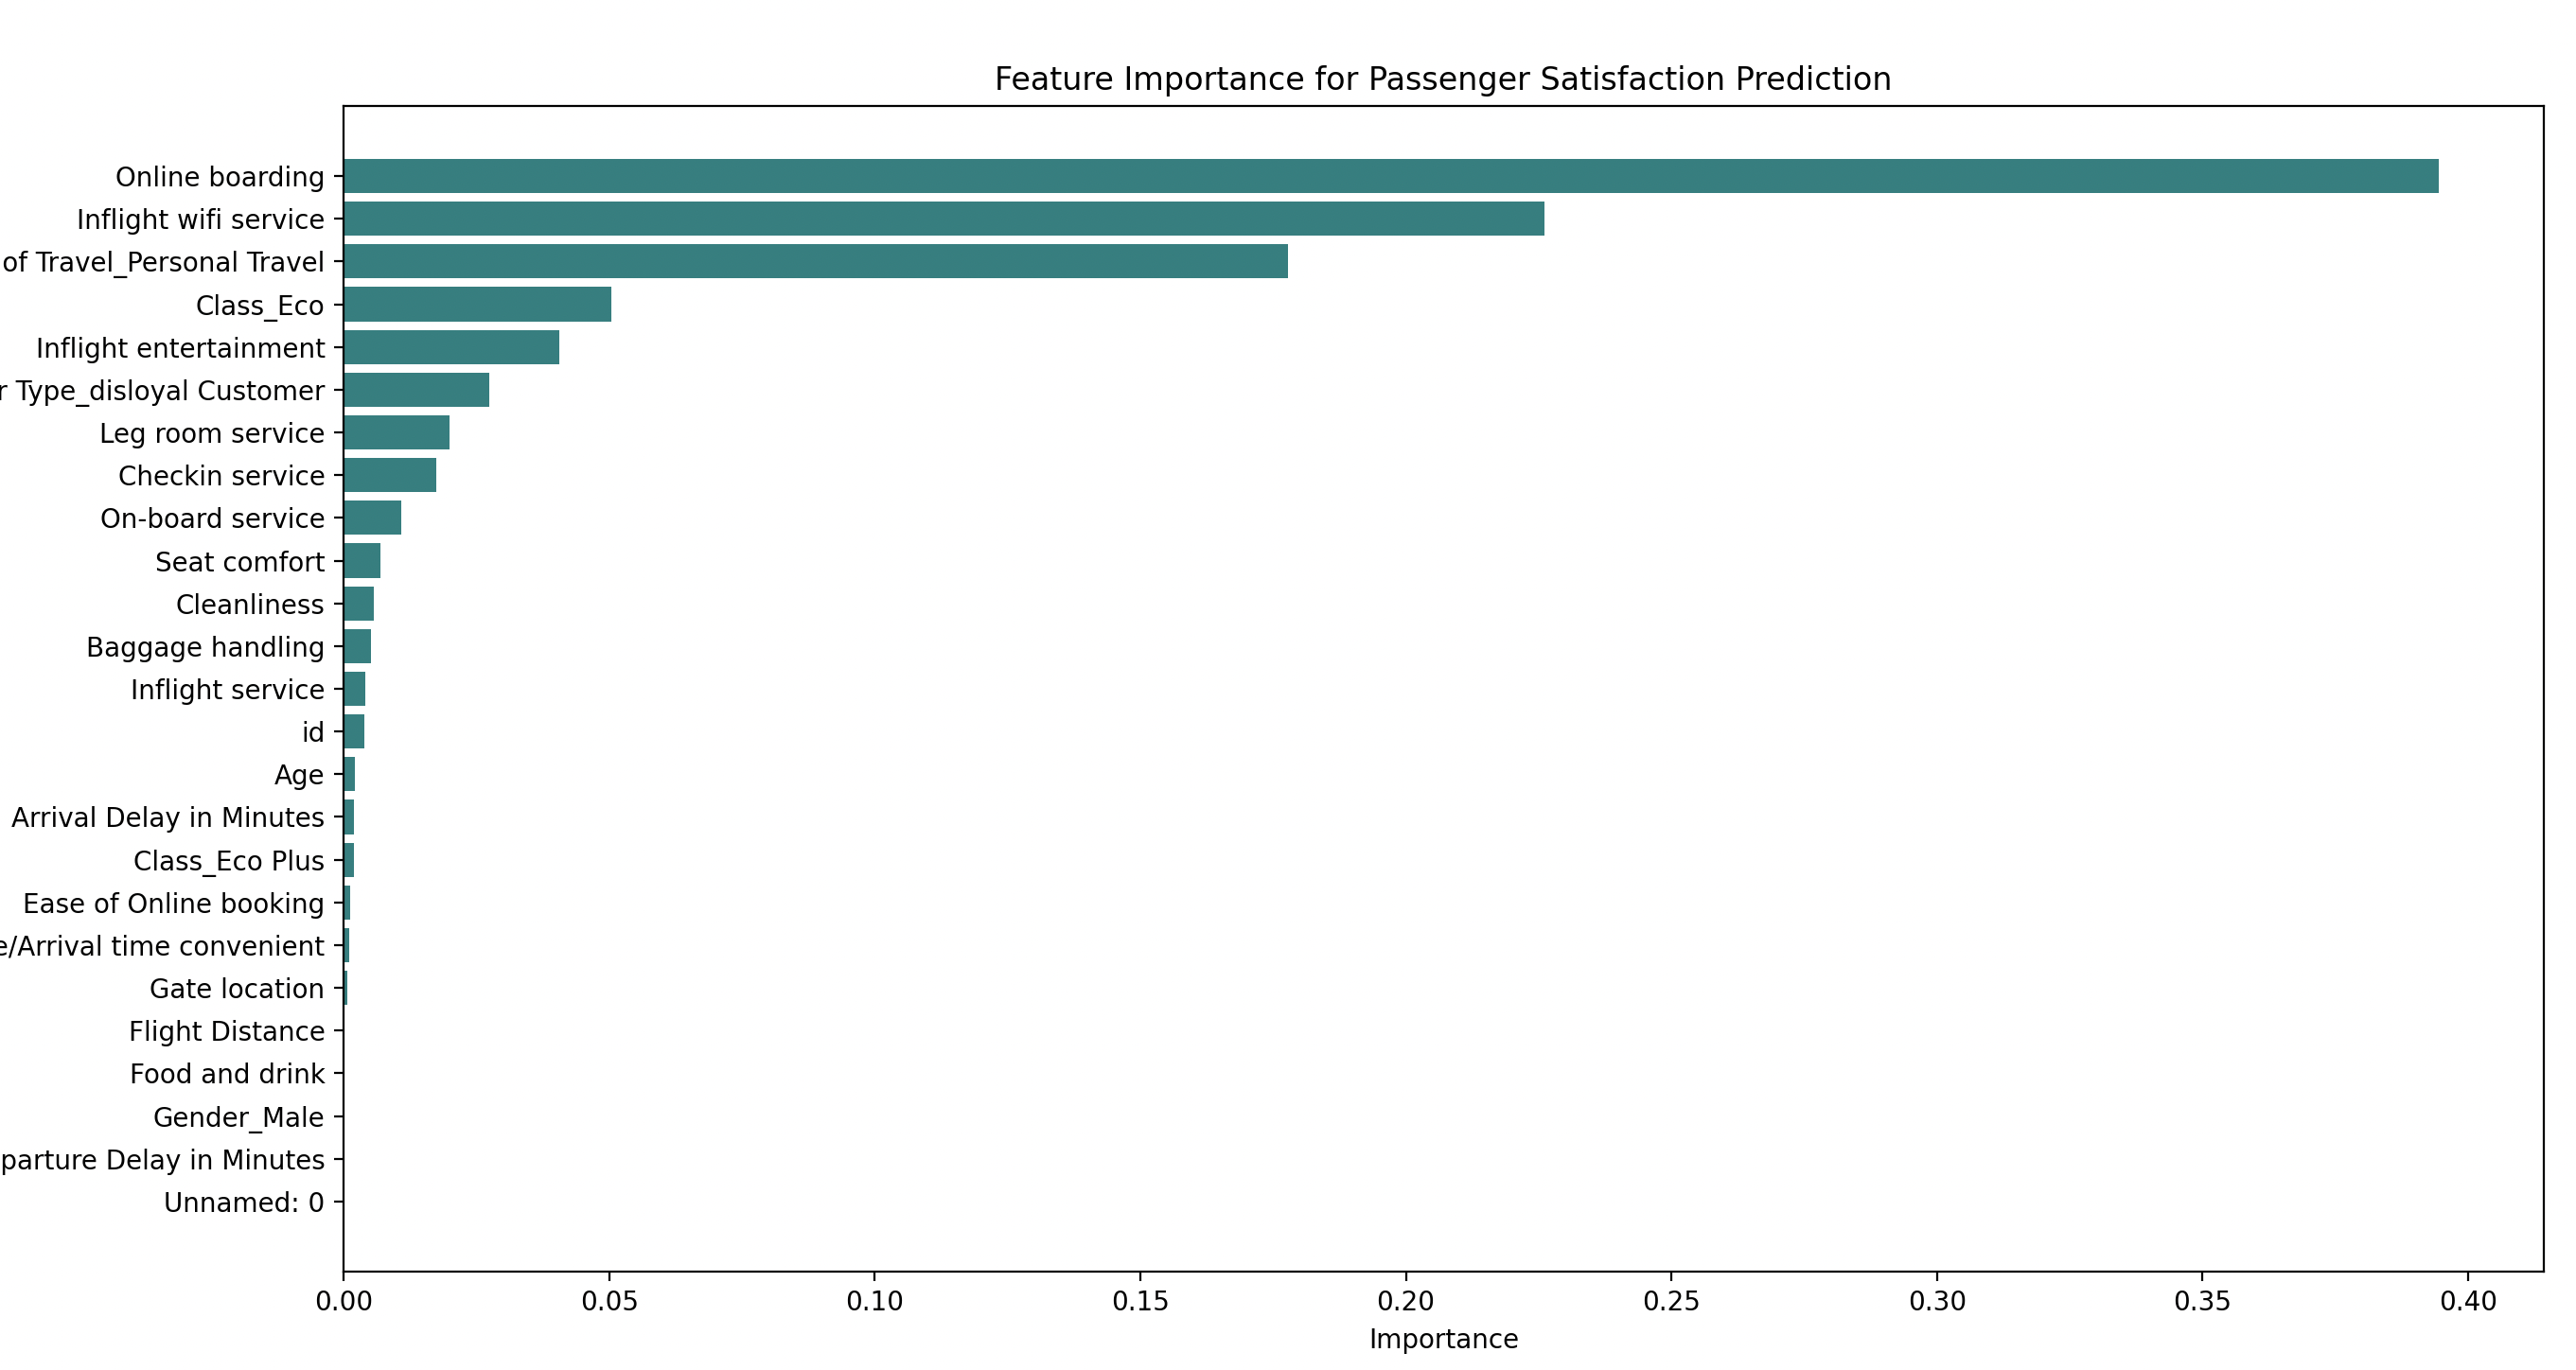
Feature Importance Visualization
Feature importance helps us understand which features (e.g., age, flight distance) have the most impact on the model’s predictions.
feature_importance = model.feature_importances_
sorted_idx = np.argsort(feature_importance)
plt.figure(figsize=(15,8))
plt.barh(X_train.columns[sorted_idx], feature_importance[sorted_idx], color='teal')
plt.xlabel('Importance')
plt.ylabel('Features')
plt.title('Feature Importance for Passenger Satisfaction Prediction')
plt.show()
Model Performance
With an accuracy of 94%, the Gradient Boosting Machine (GBM) model performed well in predicting airline passenger satisfaction. It correctly identified most of the satisfied and dissatisfied passengers, with some missed cases. From the confusion matrix heatmap we can see:
- 13,919 True Dissatisfied passengers were correctly identified.
- 10,468 True Satisfied passengers were correctly identified.
- 609 Dissatisfied passengers were misclassified as satisfied.
- 897 Satisfied passengers were misclassified as dissatisfied.
Gratitude
It was exciting to work with Gradient Boosting and see the role of each feature in predicting passenger satisfaction. Looking forward to solving more problems in this challenge!
Stay tuned!